User Tutorial
Quick Start (After Installation is Complete)
- Type ‘srxes’ in the command line. A new window should open.
2) In the upper right, click the ‘...’ button and choose a directory. SrXes will search the directory for .tif images only. If the directory is not valid or does not contain .tif images, an error message will be displayed. 3) Generate some reduced representation plots with the tools in the upper right. 4) Interact with the images.
Zoom: mouse scroll,
Pan: click and drag,
ROI: 'z' and then select region
- More detailed interactions below.
Detailed Instructions
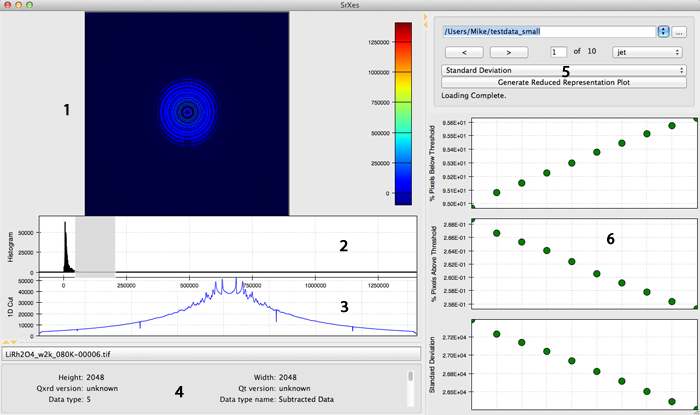
This is a screenshot of the SrXes application in use. Each part of the application has been labeled with a number for convenience purposes. Here are detailed descriptions of each component.
(1) 2D Image
This displays the diffraction image from the .tif file. It is equipped with pan, zoom, and ROI capabilites.
Pan:            click and drag
Zoom:
                zoom in                 +, mouse scroll up
                zoom out                -, mouse scroll down

                ROI                     z, then select
                                        a region with mouse

                prev state(*)           n
                next state(*)           m

                reset zoom              Esc

                x zoom in               shift + right
                x zoom out              shift + left
                y zoom in               shift + up
                y zoom out              shift + down

Mask:           Ctrl + Click + Drag on colorbar/histogram

        * The zoom tool supports a history of all zoom states that
          have been used.
(In the screenshot, the image has been masked by a range selection in the histogram.)
(2) Histogram
This displays a histogram of intensities across the diffraction image. It is equipped with zoom and pan capabilities. (the controls are the same as for the image)
(3) 1D Cut
This displays a plot of some piece of information about the image. Currently, this is a plot of mean intensity per column vs column number.
(4) Metadata
This displays the metadata for the image. If no .metadata file is present for the image, this region is left blank.
(5) Control Panel
This contains tools to interact with the data set. The first line is the current directory. Once a directory has been chosen (click the ‘...’), the data will automatically load into the viewer. The directory editor will remember up to 5 of the last directories opened. Additionally, SrXes will open up the last used directory on startup automatically.
Below that are arrow keys to switch between images. Images can also be switchedwith the keyboard arrow keys (however, the image must be the focus to have thisfunctionality). There is also an option to choose a new colormap (sometimes the colormap will not update automatically. To fix this, interact with the plot to update it.)
Below that are the choices of reduced representations. Currently the following reduced representations are supported:
Total Intensity
Mean Intensity
Standard Deviation
% Pixels Below Threshold   (the last two must have a range selected
% Pixels Above Threshold    to work)
Error messages and other information will be displayed at the bottom of the panel.
(6) Reduced Representation Plots
Generated RR plots will be displayed here. Up to 3 can be generated at one time. If another plot is created, the first plot will be removed and the new plot will be added. If a plot is removed, it will remain saved and can be displayed again if needed)
Within an RR plot, the user can hover over an individual point and its filename will appear in the control panel. The user can also select any number of points and the last selected plot will be displayed on the left.
These plots are equipped with Zoom and Pan functionalities as well. The controls are the same as for the image